
2.1.1. Energy Resources:
Energy inputs are the
critical components of national economic activity of our country, which
contributes in increasing the gross domestic product (GDP )
at an average annual rate of over 7% since 2004. However, it is believed by all
concerned around the world that the conventional sources of energy,
particularly the fossil fuels, will get exhausted by the turn of this century.
It is, therefore, essential to identify the different energy resources, their
potential reserves, and sustainability.
All the energy sources are
divided into two groups- Renewable and Non- renewable.
Renewable Energy:
Renewable
energy includes solar, wind, hydel, bio-mass and geothermal resources.
Solar:
The sun's rays, or solar energy,
have been used since the beginning of time and is vital to all living things.
In addition to solar energy being a constant resource, heat and electricity are
other forms of energy those can be made from free and unlimited source of solar
energy. The sun is although 93 million miles away, but there would have been no
life on earth without it. From growing crops to heating our homes, the sun is
becoming more dependable than ever before, as new technologies harness its
energy to supply the needs of our present-day society.
It is the unique source from which directly or
indirectly fuel is made. The sun creates convective heat currents that stir the
winds in our atmosphere. The sun drives the hydrological cycle causing water to
evaporate and condense. Plants also process radiant energy through a process
called photosynthesis.
India
is endowed with rich solar energy resource since it is located in the
equatorial sun belt of the earth. Theoretically, India receives about 5000
trillion kWh solar radiations (power) with about 300 clear sunny days in a
year. The daily average solar energy incident over India varies from 4 to 7
kWh/m2 with about 2,300–3,200 sunshine hours per year,
depending upon location, which is far more than the current total energy
consumption. While India has technology and sunlight in abundance, and while
these are key ingredients for a green energy future, it is daunting to think
solar thermal and solar electric power can increase their share of energy
production from today’s negligible percentage to provide all needed growth in
energy production within a generation.
For conventional human usage, sunlight must be captured and converted.
Solar-powered devices are the most direct way to transform raw thermal energy
into electricity.
Wind: Winds
are caused by the uneven heating of the atmosphere by the sun, the
irregularities of the earth's surface, and rotation of the earth. The earth’s
surface is made of different types of land and water. These surfaces absorb
sun’s heat at different rates, giving rise to the differences in temperature
and subsequently to winds. During the day, the air above the land gets heated
up more quickly than the air over water. The warm air over the land expands and
rises, and the heavier, cooler air rushes in to take its place, creating winds.
At night, the winds are reversed because the air cools more rapidly over land
than over water. In the same way, the large atmospheric winds that circle the
earth are created because the land near the earth's equator is heated more by
the sun than the land near the North and South Poles. From ancient times till nineteenth century, the
manufacture and use of sailing ships determined the economic and political
power of nations. The first known use of sailing ships was by the Egyptians in
2800 B.C. Further, the first uses of the wind for mechanical power appear to
have been developed in Persia where water was pumped for irrigation by
windmills. Between the seventh and tenth centuries, windmills were firmly
established in Persia. By the thirteenth
century, windmills were common in Europe, with significant advances being made
by the Dutch and the English. Wind mills were evolved only for grinding grain and water
pumping purposes. But at present the wind turbines convert
the kinetic energy of the moving wind into electricity. Wind
Energy, like solar energy, is free resource, but is much intermittent than the
solar. Wind speeds may vary within minutes and affect the power generation and
in cases of high speeds it may result in overloading of generator. The
range of wind speeds that are usable by a particular wind turbine for
electricity generation is called productive wind speed. The power available
from wind is proportional to cube of the wind's speed. So as the speed of the
wind falls, the amount of energy that can be received from it falls very
rapidly. On the other hand, as the wind speed rises, so the amount of energy in
it rises very rapidly. However, productive wind speed ranges between 4 m/sec to
35 m/sec. The minimum prescribed speed for optimal performance of a wind mill
is about 6 m/s. Wind power potential of a place is mostly assessed considering
wind power density higher than 200 W/m2 at 50 m height.
It
is a known fact that wind high above the ground is stronger than winds near the
ground. On average a five-fold increase in elevation, say raising the height of
the wind machine from 10 feet to 50 feet, the power of available wind will be double.
That’s why wind turbines are placed on tall towers and is often located on
mountains or hilltops. On the other hand, in our country ‘on-shore’ potential
for utilization of wind energy for electricity generation is of the order of
65,000 MW. India is also blessed with 7517km of coastline and its territorial
waters extend up to 12 nautical miles into the sea. This unexploited resource
availability has the potential to sustain the growth of wind energy sector in
India in the years to come. Total installed capacity of electricity generation from
wind is 13,065 MW; out of the estimated potential it is more than 65000 MW.
But, if sea based opportunities are taken into consideration then it will be
much higher (Sukhatme, 2011).
Air temperature is
also an important factor in wind power generation. Cold air is denser than hot
air. Thus, wind turbines are able to generate about 5% more power at any given
wind speed in the winter than they are during the hot days of summer. Wind in India is, thereby, influenced by the strong
south-west summer monsoon, which starts in May-June, when cool, humid air moves
towards the land and the weaker north-east winter monsoon, which starts in
October, when cool, dry sir moves towards the ocean. During the period march to
August, the winds are uniformly strong over the whole Indian Peninsula, except
the eastern peninsular coast. Wind speeds during the period November to march
are relatively weak, though higher winds are available during a part of the
period on the Tamil Nadu coastline. However,
our country is used to use wind energy from ancient times for domestic as well
as community purposes. At present, wind energy is directly used to produce
electricity
|
Hydel: This is one of the earliest known renewable energy sources,
in the country since beginning of the 20th century. In fact, for the last few hundred years, people living in
the hills of the Himalayas have been using water mills, or chakki, to
grind wheat. The 130 KW small hydropower plant in Darjeeling set up in 1897 was
the first in India.
The production of electricity using the energy
of flow of water in rivers, small streams, water falls and dams is based on the
basic scientific concept of mechanical energy converted into electricity
exploiting the Faradays law of electromagnetic induction. Waves result from the interaction of the wind with the
surface of the sea and represent a transfer of energy from the wind to the sea.
Energy can be extracted from tides by creating a reservoir or basin behind a
barrage and then passing tidal waters through turbines in the barrage to
generate electricity. Hydro power is one of the best, cheapest, and cleanest
sources of energy, although, with big dams, many environmental and social problems
have been seen as in the case of Tehri and Narmada Projects. Small dams are not
only, free from such problems, but also free from problems like affecting the
lives of thousands of people living along the banks of the rivers, destruction
of large areas under forest, and seismological threats. New environmental laws
affected by the danger of global warming have made energy from small hydropower
plants more relevant.
Energy is also obtained from waves and tides. The first wave
energy, project with a capacity of 150MW, was set up at Vizhinjam near
Trivandrum. Till date India has
installed hydroelectric power plant of 32,326 MW against a potential of
1,50,000 MW. The power plant with capacity greater than 25MW is called large
hydel plant. Water energy of any small stream flowing in a hilly terrain can
also be harnessed for generating electricity to meet energy needs
of remote rural areas. These small
hydropower plants can serve the independently. Till date, small or micro hydro plants of total capacity
of 2953 MW have been installed against an estimated potential of 15400MW
(Sukhatme, 2011).
Energy from the sea - Ocean thermal, tidal
and wave energy
Large
amounts of solar energy are stored in the oceans and seas. On an average, the
60 million square kilometer of the tropical seas absorb solar radiation
equivalent to the heat content of 245 billion barrels of oil. Scientists feel
that if this energy can be tapped a large source of energy will be available to
the tropical countries and to other countries as well. The process of
harnessing this energy is called OTEC (ocean thermal energy conversion). It
uses the temperature differences between the surface of the ocean and the
depths of about 1000m to operate a heat engine, which produces electric power.
|
Bio- energy: Bio-energy
is an important form of renewable energy that is stored in biological material
like wood, wood-waste, manure, straw and other-products of agricultural
processes. Bio-energy in these sources can be converted and used to generate
heat or electricity, or to produce transport fuel. The source of bio-energy is
organic material – which refers to biomass, which is effectively a store of
solar energy, Energy from the sun is captured through photosynthesis and stored
as the plant or tree grows. It
is either:
·
the direct product of photosynthesis (for
example plant matter – leaves, stems, etc.) or
·
the indirect product of photosynthesis (for
example animal mass resulting from the consumption of plant matter).
Biomass
is defined as the total mass of living organisms in a given area or of a given
species is usually expressed as dry weight. Organic matter consisting of or
recently derived from living organisms (especially regarded as fuel) excluding
peat. Biomass includes products, by-products and waste derived from such
material. Cellulosic biomass is biomass from cellulose, the primary structural
component of plants and trees (IPCC 2007). An alternative
name for biomass used to produce bioenergy is a “feedstock.” The main
categories of feedstock are: oil seed crops, grains, sugar crops, and
agricultural residues, trees, grasses, and algae (Pena 2008). The last category
containing trees and grasses is commonly referred to as cellulosic biomass.
Different parts of the plants are used depending on the category of feedstock.
For example, fats and oils from oil seed crops, such as soybeans, can be
directly converted to biodiesel using the processes of transesterfication or
hydro- treating. The possible products that can be derived from biomass include
biodiesel, ethanol, butanol, methane, hydrocarbons, and natural oils, which can
be further processed into any number of desirable fuels (Pena 2008). Rotting garbage, and agricultural and human waste, all
release methane gas—also called "landfill gas" or "biogas."

(a) Bio fuel: About 51% of solar energy reached on the earth can be converted into bio-fuel energy by green plants. The Rural people of India depend mostly on fuel-wood for cooking but there is a great gap between demand and supply. India has a great scope for energy plantation on 70 million ha and can generate wood biomass to the tune of 560 million tones of fuel biomass. From the energy plantation on an average 4000 kcal/kg energy can be produced.
(b)
Bio-ethanol: Bio-fuels are potential alternatives
to the liquid fossil fuels as they can directly be blended with petrol /
diesel. Bio-fuels are of two types : alcohols (ethanol and butanol) and diesel
substitutes (bio-diesel and hydro-treated vegetable oils). Ethanol produced
from starch and sugar has remarkable characteristics of having high latent heat
of vaporization, high octane number, rating; emission of toxic compounds on
combustion is also low as compared to gasoline. Presently, approximately 1
million ton against a potential of10 million ton is being produced in India. The
raw materials used for production of ethanol are cellulose available from wood, agricultural residue, waste from paper
industries, municipal solid waste etc.
(c )
Bio diesel: Bio
diesel is another type of liquid fuel which is produced from non edible tree
seed’s oil. By the process of trans-esterification of these oils, glycerin and
bio diesel are produced. The potential of such resources in India
(d)
Wood: Wood is considered humankind’s very first source of energy.
Today it still is the most important single source of renewable energy
providing over 9% of the global total primary energy supply. Wood energy
is as important as all other renewable energy sources altogether (hydro,
geothermal, wastes, biogas, solar and liquid biofuels). . Fuelwood and
charcoal production is often the predominant use of woody biomass in developing
countries and economies in transition. A common
hardwood has an energy content of 14.89 mega
joules per kilogram (6,388 BTU per pound), and
10.423 mega
joules recoverable if burned at 70% efficiency.
|
Bio-energy also includes human and animal energies. From ancient times the power vis-à-vis energies of these two resources were extensively used for wellbeing of the society. Till date more than 55% of the total cultivated area is still being tilled by draught animals. In India bullocks, buffaloes and camels are the major draught animals for field operations. Horses, mules, donkeys, yak and mithun are the pack animals for transport. We are also resourceful in human labour as well.
Non-renewable Energy
Resources:
The non-renewable energy resources include fossil
fuels viz. coal, lignite, crude oil as well as natural gas along with fossil-fuel-like
substances like coal-bed-methane, gas hydrates etc. Nuclear energy is the other
important non-renewable source which produces energy in exothermic nuclear
reactions involving uranium, plutonium and thorium.
Coal & lignite:
India has 38,930 million ton reserve of lignite, called brown coal, but even
then we are to import coal to meet our deficit. In 2009- 10 around 73 million
ton of coal was imported (Sukhatme, 2011) and with the passage of time we have
to import more and more coal to meet our energy needs.
When coal is burnt in
the presence of oxygen, carbon dioxide (CO2) is produced in an
exothermic chemical reaction, as shown below:
C
+ O2 → CO2 + Energy (Heat) .
It has been observed that burning of 1 kg coal
yields 6150 Wh (22.14 MJ) of heat energy.
Crude
oil and natural gas: In 2009-10 India
Besides
these energy resources, coal-bed-methane and gas hydrates are also considered
as most important source; and coal-bed-methane is the major component of
natural gas found in the coal mines. It may be mentioned as example - while
drilling well, water comes out first and then methane flows out of the well due
to reduction of pressure. There are
abundant reserves of gas hydrates in the deep sea of Andamans
Geo-
thermal energy: Deep inside the
earth, the rocks are in a super heated molten form called magma. Sometimes
water that seeps into the earth, through cracks in the rocks, comes in contact with
this molten magma. This results in the water getting super-heated.
This hot water can reach temperatures of more than 1500 C. That's a lot hotter than boiling water, which boils 1000 C. As the water heats up, it rises up to the surface of the earth and spews out of the cracks. The steam and water that comes out with so much force that it sometimes rises as high as 500m. This heat energy, hidden under the surface of the earth, is called geothermal energy.
This hot water can reach temperatures of more than 1500 C. That's a lot hotter than boiling water, which boils 1000 C. As the water heats up, it rises up to the surface of the earth and spews out of the cracks. The steam and water that comes out with so much force that it sometimes rises as high as 500m. This heat energy, hidden under the surface of the earth, is called geothermal energy.
However,
geothermal energy is difficult to handle. First, there are very few areas of
such geothermal activity. Secondly, the areas where such activities occur are
highly prone to earthquakes. Lastly, the chemicals that come out of the earth,
as part of the steam, can be very harmful to the machines and equipment used to
generate electricity.
Nuclear energy sources:
Nuclear energy is an important non renewable energy source, which produces
energy in the exothermic nuclear reactions involving uranium, plutonium and
thorium. This source is used to generate electricity and it is produced through
nuclear fission and fusion.
Fission
of 1gm of uranium (235) produces energy of 22.8 X10³ kWh. With this
energy one can run a 1 kw electrical heater nearly for 1000days. Further, in
nuclear fusion, deuterium is used, which is abundantly available in sea water.
Several countries, including India, has initiated together a programme called
the International Energy Reactor for gaining experience of setting a fusion based nuclear plant.
|
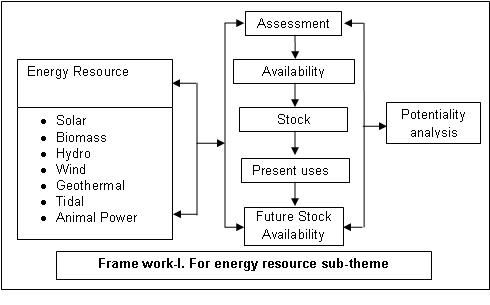
2.1.1.1. Framework
2.1.1.2.
Model
Project
Project –I. : Explore and identify energy resources in and
around you
STEP 1: A
group of children
explores the sources of energy in a locality. They maintain an observation
sheet and interview people to know about the sources of their day to day energy
requirement. At this time they don’t do the classification and only list down
the sources, i.e. –
a. Sun
b. Biomass
(firewood, cowdung cake, charcoal, food & fodder etc.)
c. Wind
power
d. Animal
muscle power
e. Human
muscle power
f. Petroleum (Petrol, Diesel, Kerosene, Candle)
g. Coal
h. Water
flow
i. LPG
STEP 2: Now
the children, with help of local expert and books try to know the origin of the
sources and try to classify them into BIOTIC and ABIOTIC -
Biotic
|
Abiotic
|
a. Biomass
b. Animal
muscle power
c. Human
muscle power
|
a. Sun
b. Wind
c. Petroleum*
(Petrol, Diesel, Kerosene, Candle)
d. Coal
e. Water
flow
f. LPG
|
*Petroleum
sources although originates from plants and animals, by the time they transform
to usable energy forms, they become abiotic.
STEP 3: Then
Children try to classify the sources as renewable and non-renewable
Renewable
|
Non-renewable
|
a. Sun
b. Biomass
c. Animal
muscle power
d. Human
muscle power
e. Wind
power
f. Water
flow
|
a. Petroleum
(Petrol, Diesel, Kerosene, Candle)
b. Coal
c. LPG
|
STEP 4: Then
Children explore various usage of the different forms of energy found in the
locality through observation and interview of local people in the following
format–
Sources
|
Current
usage (imaginary)
|
Possible
usage
|
a. Sun
|
a. Drying,
heating, lighting (small scale)
|
a. Cooking,
water heating, electricity generation, vehicle running. Large scale rural
electrification/ Solar power grids
|
b. Biomass
|
b. firewood,
charcoal, food & fodder etc.
|
b. Energy
cake, bio-electricty using biomass gasifier, bio diesel
|
c. Wind
|
c. Water
lifting
|
c. Electricity
generation
|
d. Animal
muscle power
|
d. Agriculture,
Transport
|
|
e. Human
muscle power
|
e. Agriculture,
Transport, other physical work
|
|
f. Petrol
|
f. Vehicle
running, electricity generation
|
|
g. Diesel
|
g. Vehicle
running, electricity generation
|
|
h. Kerosene
|
h. Household
lighting, cooking
|
|
i. LPG
|
i. Cooking
|
d. Vehicle
running, industrial use,
|
j. Coal
|
j. Cooking
|
e. Thermal
power,
|
k. Water
flow
|
k. Not
used
|
f. Micro/
Pico-hydel
|
Step – 5. Experimentation
for possible use/effective –optimum use
Identify any one of the sources already identified
and try to bring out some way to establish possible uses or enhancing
effectiveness of optimal use through an experiment and observation based on a
functional model/ field base experiment -observation.
|
Project
– II. Nature of availability of solar and thermal energy resources in a village
Although several sources of energy are available for exploitation
on earth (e.g., geothermal, nuclear decay), the most significant is solar
energy. Light and other radiation streaming out from the sun strikes the earth
93 million miles distant, providing energy to the atmosphere, the seas, and the
land, warming objects that absorb this energy; that is, radiant energy is
converted to heat energy (molecular motion). Differential heating causes winds
and currents in the air and water, the heat energy becoming kinetic
energy of motion. Warming results in evaporation of water into the
atmosphere, setting up the hydrologic cycle. The lifting of water into the
atmosphere becoming potential energy that will convert to
kinetic energy when the water begins to flow back downhill. So, solar energy
not only plays most significant role in determining the resource base of any
geographical situation, but also essentially
required for growth and survival of living organisms.
Further, considering
climate change scenario, the nature of availability of solar vis-à-vis thermal
energy at different time periods of any location is to be known for planning
living quality.
Objective: To study
nature and availability of solar and thermal energy resources in an area.
Materials
required: (i) A
simple
thermometer
(ii)
A Sun-dial (to
be made by the children)
(iii) Arrangement for hanging thermometer
(a
wooden pole with hook)
(iv) Field note book
Methodology:
Step – 1. An open area in the dwelling village of the
children who will take up the project is to be identified; keeping in view that
the area should not be influenced by tree shade or any other interference at
any time of the day. A play ground will be the ideal area.
Step – 2. The
pole and the sun-dial are to be placed at the centre of the area.
Step – 3. Temperature readings to be recorded at (i)
at ground level and (ii) 1.5 m height at different time in a day ( preferably
at 08, 12, and 16 hours).
Step-4. The day length (preferably bright
sun-shine hour) is to be recorded with sun-dial from dawn to dusk.
·
This
should be recorded every day and to be continued for two months in the
following tabular form-
Table:1.
Diurnal air temperature (oC)
Day
|
Date
|
At
ground level
|
At
1.5 m
|
||||
8
hr (A)
|
12
hr (B)
|
16
hr (C)
|
8
hr (A)
|
12
hr (B)
|
16
hr (C)
|
||
Mean
|
|||||||
Table:2.
Day-length/ Bright sunshine hour by days
Day
|
Date
|
Day
length, hr
|
Total
radiation available*
|
Energy,
Watt/d
|
Mean
|
Table:3. Mean temperature at different day time and
inversion layer
Day
|
Mean
Temperature (oC) at ground level
(A+C)/2
|
Mean
Temperature (oC) at 1.5 m height
(A+C)/2
|
Inversion
Layer*
(C – A)
|
Note: * A layer of air that
is warmer than the air below it is called an inversion layer (Gordon et al.1980). Such
a layer traps the surface air in place and prevents dispersion of any pollutants
it contains.
Table:4.
Cumulative temperature
Day
|
Date
|
Mean
temperature
|
Cumulative
temperature**
|
||
At
ground level
|
At
1.5 m height
|
At
ground level
|
At
1.5 m height
|
||
X1
|
y 1
|
x1
|
Y1
|
||
x2
|
y2
|
x1 + x2 = xa
|
y1 + y2 = ya
|
||
x3
|
y3
|
xa + x3 = xb
|
ya + y3 = yb
|
||
Total
|
|||||
Note: ** Cumulative temperature, which gives total thermal energy for a
given period is important for selection of crop and adoption of cultivation
practices
·
The
two month’s data can be converted to weekly data and respective mean values to
be calculated.
·
Finally
total amount of energy availability from these two sources can be calculated
both by weeks and months.
·
The
profile of energy from temperature can be compared through graphical analysis,
·
Variation
at two different situations can also be compared.
·
The
diurnal temperature can be correlated with day length
·
Cumulative temperature, which indicates
thermal energy availability at a given time for a place, can also be compared
by weeks and months.
This study can be taken up in any geographical
situations. Further, there may be two different projects on thermal and solar
energy or both can be considered together to study the interrelations of the
two energy resources.
|
Project
– III . Study on bio-resource potential in a village
Biomass can be understood as regenerative (renewable) organic material that can
be used to produce energy. These sources include aquatic or terrestrial
vegetation, residues from forestry or agriculture, animal waste and municipal
waste. In fact, it is composed of organic matter found in flora throughout the
world as well as manure of some animals. The simple explanation is that the
natural plants collect energy from the sun. This is converted, through
photosynthesis with the other compounds, within the plants, making a source of
solar energy. This energy is displayed in the use of wood for home and industry
use. With the exception of manure, which is converted by the use of yeast, the
materials are burned to produce the energy. The use of municipal waste has been
very effective in the production of electricity, as well as gas using this
theory.
For many years there has been much controversy over
the disposal of animal waste such as manure. In large animal farm this can be a
problem. It has now been found that this waste can be turned into methane gas
by using anaerobic digestions plants. It is
expected that biomass products will one day supply the entire world's energy in
place of many of the forms now used. Thus, one
can be assured that when the secret of really unleashing biomass power is revealed and applied it will greatly
benefit the entire world. Hence,
Estimating of resources from different
bio-sources is required to be known as first hand information for planning and
management for improving quality of life of rural mass.
Objective: To estimate different bio-resources in a village.
Materials required:
(i)
Village
map
(ii)
Questionnaire
(iii)
Basket
(preferably bamboo made)
(iv)
Rope
for hanging basket in the spring balance
(v)
Spring
balance
Methodology:
Step -1: A village where the participating children
dwell the need to be selected
Step – 2. Using questionnaire following information
is to be collected.
(i) Name
of the village (with JL number)
(ii) Area
of the village (To be marked in the map)
(iii) Number
of household
(iv) Number
of people per household
(v) Number
of labour force
(vi) Amount
of farm and/or kitchen waste
(vii) Types and number of domesticated animals
Type of
animal
|
Number
|
Cow
|
|
Bullock
|
|
Sheep
|
|
Goat
|
|
Hen
|
|
Amount of animal dung/
excreta available/household/day
Step – 4. . If the village is very large, children
will have to undertake survey in some randomly selected households of the
village. The number of household should be more than 50. They will visit the
cowshed and measure the amount of cow dung with the help of basket and spring
balance. This should be repeated for 3 – 5 days in the sample households.
Step – 5. . The amount of farm waste available per
day is also to be measured and estimated
for yearly availability
Step – 6.. The average amount of dung/excreta
available in the sample household will be used to calculate total amount of
dung/excreta available in the village in a year. The seasonal differences,
where ever possible, can also be calculated.
Step – 7.. Finally total amount of excreta and waste
are to be calculated for the village as a whole.
Step – 8. The whole bio- resources are to be
converted in form of energy using conversion factors.
Step – 9. . The total labour force also to be
converted in terms of energy multiplying by the conversion factor
Table: Conversion factors
Particulars
|
Energy conversion
factor
|
Human labour
|
0.1779 MJ/man-hr
|
Bullock
|
1.34 MJ / bullock
|
Cow dung
|
|
Farm waste
|
80 – 200 kCal/kg
|
·
Children
will then compare yearly and/or seasonal availability of different resources in
that particular village.
Project
– IV. . : Assessment of hydel energy (Water) in a flowing water body
Objective: To study the kinetic energy in a stream flow
Materials
required:
1.
Map
of the area
2.
Colour
pen
3.
Tracing
paper
4.
A
piece of small float
5.
A
long string
6.
Bamboo
poles
7.
A
float (may be a piece of thermocol or cork)
8.
Stop
watch
9.
Measuring
tape
10. Note book
Methodology:
Step – 1. A stream or an open channel is to be
identified
Step – 2. Map should be traced in the tracing paper
and the location of the stream flow/ open channel is to be marked showing
direction of flow,
Step – 3. The children will visit the place and
identify a segment of the channel.
Step – 4. The bamboo poles are to be put in two ends
of the segment.
Step – 5. They will then measure the length of the
flow in the channel.
Step – 6. Using bamboo poles depth of the flow is to
be measured.
Step – 7. The bamboo poles are also to be put just
opposite side of the channel in a line of the previously placed the poles (as
shown in the diagram).
Step – 8. The strings are to be tied across the
channel at both the ends.
Step -9. The float will be placed at the top of the
channel (marked A)
Step – 10. With
the stop watch the time of run of the float will be recorded.
Step – 11. Then the calculations will have to be
performed –
(i) cross sectional area of the channel, A (sq. M)
(ii) depth of the flow, h( m)
So,
the volume of water in the section, V = A* h (m3)
Since
density of water is 1, so V = M (mass), g
(iii) Velocity, P = L (length of the channel section)/
time , m/sec
Finally, Kinetic energy of the flow will be
calculated using the following equation
KE = ½ M* V2
Note: This study can be undertaken before and after the
rainfall, thereby a comparative study on energy in flowing channel can be made.
2.1.1.3.
Suggestive
project idea
(i) Quantification
of heat generated in exothermic
chemical reactions (such as burning of coal, wood, charcoal, gas etc
(ii) Identification of estimation of components of the
gas produced from cow dung, kitchen
waste, human waste, tree leaves etc.
(iii) To study
potential wind velocity in an area.
(iv) Estimation of incidence of solar radiation
(v) Estimating biomass energy stock in a school compound
(vi) Measuring kinetic energy in a stream
(vii) Comparative study on thermal energy availability in open
and closed spaces in urban area.
(viii) Collection and recording of different plant parts
and seeds available for use as food and fuel.
(ix) Estimating Growing Degree Days (GDD) using
time-scale recording of atmospheric temperature
(x) Measuring and correlating air and soil temperature
and thermal resources
கருத்துகள் இல்லை:
கருத்துரையிடுக